
Weather forecast applications are a prominent part of our daily lives. They help us plan our day and stay ahead of any inclement weather.
Nowadays, every smart device includes one of those apps. You can find them in smartphones, smart bands, smart assistants, and even refrigerators.
While weather forecast applications have varying degrees of complexity, they all boil-down to the same basic principle: Showing you the expected weather for the upcoming day.
Creating a weather forecast application is a great place to start with your coding journey, since this can be a challenging yet useful project, without being too overly complex.
In this article, we will be utilizing the power of Python and Flask to build a simple weather forecast application that you can access through your web browser.
Python is a versatile, high-level programming language that is easy to learn and widely used for a variety of applications. Flask is a popular Python web framework that enables us to develop web applications with ease. By combining them, we can build dynamic and interactive web applications that can do almost anything we can imagine!
In this article, you are going to find a comprehensive guide for beginners on how to create a weather forecast application using Python and Flask. I will be covering all the essential steps involved, from setting up the development environment to deploying the application to a hosting platform.
Let’s get started!
TL;DR
In this article we will use Flask and Python to develop an application from scratch. This application will retrieve the local weather information by calling OpenWeatherMap’s API and will display the results in your browser, with some basic styling on top.
You can access the project’s code in this GitHub repository.
Setting up the Development Environment
Before we can start building our weather forecast application, we need to set up our development environment. Here’s what you’ll need to get started:
-
Python: You will need to install Python on your computer. You can download it from the official Python website.
-
Flask: Once you have Python installed, you can install Flask using the Python Package Manager (pip). Install it by running the following command in your terminal or command prompt:
pip install flaskNote: It is recommended to work on a virtual environment before installing modules like Flask. Virtual Environments allow you to isolate dependencies from the rest of your system. You can read more on RealPython’s Guide to Virtual Environments.
-
Text Editor or IDE: You will also need a text editor or IDE to write and run your Python code. There are many options available, such as Sublime Text, Visual Studio Code, or PyCharm. If you want to know more about some good options, you can take a look at my Guide to choosing the right Python IDE.
For this project, I recommend using VS Code, but feel free to go for any other text editor if you prefer. -
API Key: To retrieve the weather data, we will be using an API. For this article, we will be using OpenWeatherMap API. You will need to sign up for a free API key to be able to use the API in your application.
-
Git: Git is a version control system that allows you to keep track of changes to your code. While it is not necessary for this project, it is a good idea to get into the habit of using version control from the beginning. You can download Git from the official website (https://git-scm.com/downloads).
Creating a new project and setting up the file structure
Once you got these tools ready, it’s time to start building our weather forecast application.
First, create an empty folder with the name Weather Forecast. This will be the root folder of your project.
Next, create a file named weather_app.py. The file structure will look like this:
📦 Weather Forecast
└── 📜 weather_app.py
Open the folder in your text editor. Then, copy and paste the following code in weather_app.py:
from flask import Flask, render_template

app = Flask(__name__)

@app.route("/")
def home():
    return 'Hello, World!'

if __name__ == "__main__";:
    app.run(debug=True)
The previous block of code is just a basic template for Flask applications. By running this script, you’ll be able to access the program by navigating to localhost:5000 in your browser. The resulting page will display a "Hello, World!" message.

In the following section, we will be retrieving data from the API and processing it with Python to display the local weather in your browser.
Understanding the API used to Fetch Weather Data
For this project, we’ll be using the OpenWeatherMap API, which allows us to retrieve the weather forecast information we need for our app.
But before we start coding, here’s a quick recap on APIs and why it’s a good idea to use them in this project.
Overview of APIs
APIs, or Application Programming Interfaces, are tools that allow software applications to communicate with each other. By calling an API, developers can retrieve and manipulate data from other applications without having to worry about the underlying technology that the data comes from.
Since modern web applications can be complex systems that work based on data coming from multiple sources, APIs are a crucial component of many modern web applications that save developers a lot of time when building said applications.
Explanation of the weather API used in this project
OpenWeatherMap is a service that provides weather information for cities around the world. They offer a free tier of access to their API, that we’ll be using to generate our weather forecast. This API provides a wide range of data, including current weather conditions, weather forecasts, historical weather data, and more.
Registering for an API key
When working with APIs, especially paid ones, you might often find that you require an API Key to retrieve the information. This way, unathorized access and unintended use can be avoided by the developers of the API.
OpenWeatherMap’s API is no exception, and you’ll need to sign up on their website for an API Key.
The process is pretty straightforward: Go to the OpenWeatherMap API website and sign up for an account. After you have confirmed your e-mail, you will receive a message with your API Key.
The API Key activation is not always immediate, and might take up to two hours to be ready to use.
With our API key in hand, we can now start building the backend of our weather forecast app using Flask.
In the next section, we’ll learn how to set up our Flask application, define routes and views, and create a function to fetch weather data from the API.
Creating the Backend with Flask
The next steps are building the backend of the application. The code we are going to write will retrieve the weather forecast information using the API key from the previous section, and will display it on a web page that you can access through your web browser.
Setting up the Flask application
Open the file we created before, weather_app.py, and add your API key at the top of the code, like this:
from flask import Flask, render_template

app = Flask(__name__)
API_KEY = "YOUR_API_KEY";
Don’t forget to replace the API Key string with your own API key.
In the previous code, API_KEY is declared outside of any function. This means that it is a global variable, and can be accessed freely by any function declared in this file.
The next step is to create a function to retrieve the weather information.
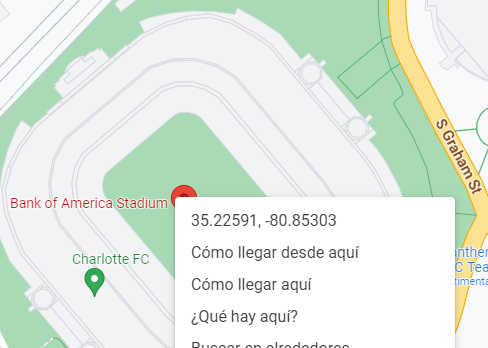
The OpenWeatherMap API lets you do this by specifying a city name, or by passing the coordinates of the place you want. Although just calling for a city’s name might seem simplier, using coordinates you can get precise weather for the area and also avoid a situation where two cities in the same country share the same name, so that’s the method I’ll be using here.
There are many ways to find the coordinates of a zip code, one of them is to go to Google Maps and right click on a location.
Now it’s time to retrieve the current weather information, calling the OpenWeatherMap APi through the get_weather_data function:
def get_weather_data(latitude, longitude):
    url = "https://api.openweathermap.org/data/2.5/weather?"
    url = f"{url}lat={latitude}&lon={longitude}&appid={API_KEY}&units=metric"
    response = requests.get(url)
    return response.json()
This function receives two parameters, latitude and longitude, that are later passed to the API call.
The url variable stores the access point to the API. Using f-strings, we replace the values for latitude, longitude, and API_KEY in the URL. I also defined &units=metric to get the temperature in Celsius. You can change this value to imperial to get the temperature in Fahrenheit.
To fetch the data from the API, you need to make an HTTP request the API’s endpoint. We can do that by importing the requests module and calling requests.get() with the URL as an argument, and storing the result in response.
Calling response after this would return a status code <Response [200]> if the request was successful, but that still won’t let us take a look at the weather data. To do that, we need to call response.json(), which will return the weather forecast data in JSON format.
JSON stands for JavaScript Object Notation, and is a format that we can use to easily parse the data from the response.
Defining routes and views
In Flask, a route represents the URL that users can visit, while a view is the function executed when that route is visited.
For example, in this app we only have one route defined ("/"), and one view (home()) that returns the string "Hello, world!" and displays it to the user.
Now, it’s time to update the home() function to display the weather for the selected location.
@app.route("/")
def home():
    latitude = 35.22592847208098
    longitude = -80.85293281605993
    weather_data = get_weather_data(latitude, longitude)
    temperature = weather_data['main']['temp']
    description = weather_data['weather'][0]['description']
    city = weather_data['name']

    return render_template('weather.html', temperature=temperature, description=description, city=city)
The previous code does:
- Define the
latitudeandlongitudeof the place we want to check. - Call
get_weather_data()and pass the coordinates we just defined as parameters. The result of performing the HTTP request is stored inweather_data, in JSON format. - In Python, data formatted in JSON can be read as a dictionary, which let’s us easily access each part of the information we are looking for.
If you take a look at the values returned byget_weather_data(), you’ll see something like this:... "main":{ "temp":284.31, "feels_like":282.71, "temp_min":284.31, "temp_max":285.21, "pressure":1027, "sea_level":1027, "grnd_level":1002, "humidity":47, "temp_kf":-0.9 }, "weather":[ { "id":802, "main":"Clouds", "description":"scattered clouds", "icon":"03d" } ], ...This is just a fragment of the data, but it shows the nested structure of the file, very similar to dictionaries. Since every part of the data contains key-value pairs, JSON files are often accessed as dictionaries in Python.
- Finally, the function
render_template()is called. This function generates, or renders, the webpage that is going to be displayed to the user, based on an HTML template.render_template()also accepts receiving values that can later be used in the HTML template.
If you try to run the code as is at this point, you will get an error since theweather.htmltemplate has not been created yet.
In the next section, we’ll go over what Jinja templates are, and how you can use them to display information to users.
Displaying the fetched data on a web page
Before knowing how to display the data on a web page, it’s important to know what Jinja templates are, and how we can use them with Flask.
Setting up the template
Since the contents of a web application are usually dynamic, that is, they are often changing, regular static HTML pages would not be enough to display the weather data we retrieved from OpenWeatherMap to the user. Instead, Flask relies on Jinja templates to create webpages with dynamic values.
Jinja templates are a type of HTML pages designed with Python in mind. While they are very similar to, they can receive parameters for dynamic content.
For example, a static HTML page that displays the current weather might look like this:
<body>
  <h1>Weather Forecast - Charlotte</h1>
  <p>The temperature is 12°C.</p>
  <p>The current weather is cloudy.</p>
</body>
Being static content, the page won’t update unless you make changes manually to it. On the other side, a Jinja template might look like this:
<body>
  <h1>Weather Forecast - {{ city }}</h1>
  <p>The temperature is {{ temperature }}°C.</p>
  <p>The current weather is {{ description }}.</p>
</body>
Where city, temperature, and description can be variables that can be replaced with values from our Python code when calling render_template() in our view.
Updating the file structure
In Flask, the templates folder is where you store your Jinja templates. Without this folder, your program won’t be able to find any HTML files that you might use.
Therefore, the file structure will look like this now:
📦Weather Forecast
 ┣ 📂templates
 ┃ ┗ 📜weather.html
 ┗ 📜weather_app.py
Displaying the data on a webpage
Finally, to display the retrieved data from OpenWeatherMap on a webpage, you’ll need to define your template on weather.html.
<!DOCTYPE html>
<html>
<head>
  <title>Weather Forecast</title>
</head>
<body>
  <h1>Weather Forecast - {{ city }}</h1>
  <p>The temperature is {{ temperature }}°C.</p>
  <p>The current weather is {{ description }}.</p>
</body>
</html>
After saving that file on the templates folder, you can run weather.py and go to localhost:5000 or 127.0.0.1:5000 to see the result.

And that’s it. We have finished building a basic weather app using Flask and Python. However, there’s still a lot that we can add to it to make it more appealing or functional
Keep reading to find out how to further improve this application.
Improving the application
Doing small retouches to the app, we can add functionality like getting a 5-day forecast or improving the look of the application.
Let’s start by adding some color and icons.
Adding a CSS Stylesheet
We can apply styles to the a HTML page using CSS stylesheets, which are "static" files. Static files are files that don’t change while you application is running, like images, JavaScript files, and CSS files.
To access static files using Flask, you need to store them in the static folder, at the root of your application.
Now, the structure of your app will look like this after creating style.css
📦Weather Forecast
┣ 📂static
┃ ┗ 📜style.css
┣ 📂templates
┣ ┗ 📜weather.html
┗ 📜weather_1.py
The next step is to link the CSS stylesheet to the HTML template. To accomplish this, we’ll use the url_for() function to find the static folder, passing the name of the file as an argument.
<head>;
<title>Weather Forecast</title>
<link rel="stylesheet" href="{{ url_for('static', filename='style.css') }}">
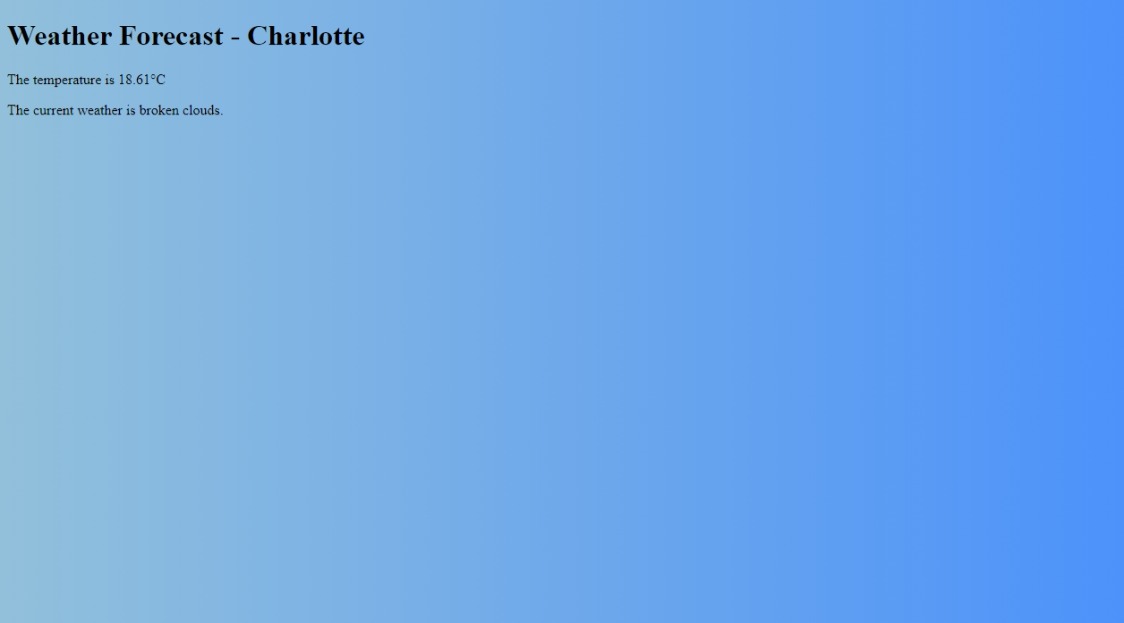
</head>And in style.css we can add a nice blue background with a gradient by passing two RGB colors to linear-gradient and setting it as a background image, like this:
body{
    background-image: linear-gradient(to right,rgb(146, 192, 219), rgb(76, 146, 250));
}
After adding the background color, the page should look like this:
In the next section, I’ll show you how to add an icon to display besides the temperature.
Adding weather icons
Images and icons help improve the look of any application considerably and instantly make it look more friendly and approachable. Thanks to the icon key included with the data from OpenWeatherMap API, we can easily identify which icon we need to show to match the current weather.
You can read more about OpenWeatherMap icons here.
To represent the different weather conditions, I downloaded the icons from this Github repository. Since these are vector graphics in SVG format, we won’t have to worry about the resolution of the icons later when upscaling them.
The process of adding icons to the application can be broken down into these steps:
- Adding the icons to the
staticdirectory. - Updating the Python code to dynamically select the right icon to display
- Updating the Jinja template to receive and display the icon to the user
- Update the design of the app using CSS
Let’s start by creating a directory with the name icons in the static directory of our application, so the structure of the application will now look like this:
📦Weather Forecast
┣ 📂static
┃ ┣ 📂icons
┃ ┃ ┣ 📜clear.svg
┃ ┃ ┣ 📜...
┃ ┃ ┗ 📜tstorms.svg
┃ ┗ 📜style.css
┣ 📂templates
┣ ┗ 📜weather.html
┗ 📜weather_1.py
Next, we’ve got to update our Python code.
Since the icon’s code is one of the values that we get from calling OpenWeatherMap’s API, I created a dictionary to map the icon codes to filenames in the icons directory:
icon_filenames = {'01d': 'clear',
                  '01n': 'nt_clear',
                  '02d': 'cloudy',
                  '02n': 'cloudy',
                  '03d': 'cloudy',
                  '03n': 'cloudy',
                  '04d': 'cloudy',
                  '04n': 'cloudy',
                  '09d': 'chancerain',
                  '09n': 'chancerain',
                  '10d': 'rain',
                  '10n': 'rain',
                  '11d': 'tstorms',
                  '11n': 'tstorms',
                  '13d': 'snow',
                  '13n': 'snow',
                  '50d': 'fog',
                  '50n': 'fog', }

@app.route('/')
...
By creating a dictionary like this, we can easily get the right filename that corresponds to each code.
For example, the dictionary will return the filename nt_clear when we call it using the code 01n as our key:
>>> icon_filenames['01n']
'nt_clear '
In order to display the selected icon, it is necessary to create a URL that points at the file, so that it can be displayed through the resulting HTML page and served to the user. To do that, we have to update the home() function.
@app.route('/')
def home():
latitude = 35.22592847208098
longitude = -80.85293281605993
weather_data = get_weather_data(latitude, longitude)
temperature = weather_data['main']['temp']
description = weather_data['weather'][0]['description']
city = weather_data['name']
icon = weather_data['weather'][0]['icon'] # Get icon filename from dictionary
icon_url = url_for('static', filename=f'icons/{icon_filenames[icon]}.svg') # Dynamically generate icon's URL
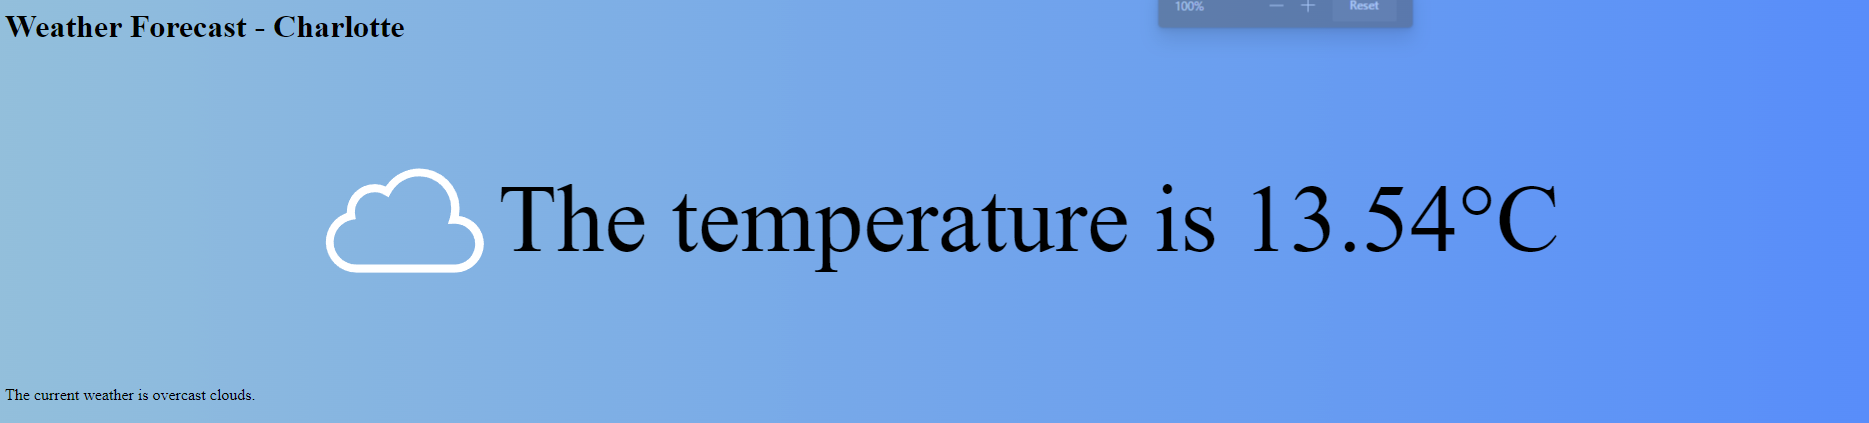
return render_template('weather.html', temperature=temperature, description=description, city=city, icon_url=icon_url) # Pass icon's URL as a parameterNext, we are going to edit our HTML template to add an <img/> tag to feature the icon for the current weather. In this case, I grouped the <img/> and <p> tags together inside a <div> to later apply styling on both elements using the CSS Stylesheet.
<h1>Weather Forecast - {{ city }}</h1>
  <div id="main-temp">
    <img src="{{ icon_url }}"/>
    <p>The temperature is {{ temperature }}°C</p>
  </div>
  <p>The current weather is {{ description }}.</p>
Finally, we add this code at the end of style.css:
#main-temp{
    /* Use flexbox to center the elements horizontally and vertically */
    display: flex;
    /* Set the font size to 96 pixels */
    font-size: 96px;
    /* Center the elements horizontally */
    justify-content: center;
    /* Center the elements vertically */
    align-items: center
}

img{
    /* Set the width of the image to 2em (relative to the font size of the parent element) */
    width: 2em;
}
Now, the page will look like this:
Tweaking the application
Before moving forward to add a 5-day forecast, there are some quick tweaks that can make our application look better.
Starting with weather.py, we can round up the temperature value, and capitalize the description of the current weather like this:
@app.route("/")
def home():
    ...

    return render_template('weather.html',\
    temperature=round(temperature), description=description.capitalize(), \
    city=city, icon_url=icon_url)
On weather.html, we can remove some of the additional text and display only the most important values to the user. I also moved the weather description to the top:
...
<body>
    <h1>{{ city }}</h1>
    <p id="description">{{ description }}</p> <!-- Add identifier to description for styling -->
    <div id="main-temp">
      <img src="{{ icon_url }}"/>
      <p>{{ temperature }}°C</p>
    </div>
</body>
...
Most changes are done in the CSS stylesheet, like switching all text to white, changing the font, and centering the headers and text:
body{
    background-image: linear-gradient(to right,rgb(146, 192, 219), rgb(76, 146, 250));
    color:white; /* Make all text white */
    font-family: sans-serif; /* Change all fonts to sans-serif */
}
...
h1, h2, h3, h4, h5, h6, #description{
    text-align: center; /* Center headers and weather description */
}
Now the application will look like this:

In the next section, I’ll show you how to add a 5-day weather forecast.
Adding 5-day weather forecast
OpenWeatherMap also provides us with a different API endpoint to retrieve the 5-day weather forecast. The information retrieved includes max and minimum temperatures every three hours for the following 5-days and the current day.
We can create a function very similar to get_weather_data() to retrieve the forecast information, calling the different API endpoint for this task:
def get_forecast_data(latitude, longitude):
    url = f"http://api.openweathermap.org/data/2.5/forecast?"
    url = f"{url}lat={latitude}&lon={longitude}&appid={API_KEY}&units=metric"
    response = requests.get(url)
    return response.json()
We are looking to display the weather in a table like this:
| Day | Weather | Max/Min |
|---|---|---|
| Tuesday | ☀ | 18°C/13°C |
| Wednesday | ☁ | 19°C/12°C |
| Thursday | 🌧 | 16°C/11°C |
| Friday | ⛈ | 18°C/10°C |
While the response from the API call includes a lot of data, only some values are relevant for this project: Date of the forecast, max and minimum temps, and icon.
For reference, the response from the API call looks like this (shortened for brevity):
  {'dt': 1677110400,
   'main': {'temp': 21.58,
    'temp_min': 19.05,
    'temp_max': 21.58,
    },
   'weather': [{'id': 803,
     'main': 'Clouds',
     'description': 'broken clouds',
     'icon': '04n'}],
   'dt_txt': '2023-02-23 00:00:00'},
  {'dt': 1677121200,
   'main': {'temp': 20.42,
    'temp_min': 18.1,
    'temp_max': 20.42,
    },
   'weather': [{'id': 803,
     'main': 'Clouds',
     'description': 'broken clouds',
     'icon': '04n'}],
   'dt_txt': '2023-02-23 03:00:00'},
   ...
If you look at the data, you can see that it is segmented in three hour intervals for the same day. While we can easily retrieve the weather conditions and the icon for each day, there is no set Max and Min values for a full day. However, we can write a function to list the hourly values and get the daily max and minimum temperatures:
import datetime # Import datetime
...
def get_max_min_temp(forecast_data):
    # Create an empty dictionary to store the temperature data for each day
    temp_by_date = {}

    # Loop through the forecast data
    for item in forecast_data['list']:
        # Extract the date and icon for the item
        dt = datetime.datetime.fromtimestamp(item['dt'])
        date = dt.date()
        icon = item['weather'][0]['icon']

        # If the date isn't already in the dictionary, add it
        if date not in temp_by_date:
            temp_by_date[date] = {'temps': [], 'icons': []}

        # Add the temperature and icon data to the dictionary
        temp_by_date[date]['temps'].append(item['main']['temp'])
        temp_by_date[date]['icons'].append(icon)

    # Loop through the dictionary to calculate the max and min temperature for each day
    for date, temps_icons in temp_by_date.items():
        max_temp = round(max(temps_icons['temps']))
        min_temp = round(min(temps_icons['temps']))
        icon = temps_icons['icons'][0]
        icon = icon_filenames[icon]

        # Replace the temperature and icon lists with the max/min temperature and the first icon
        temp_by_date[date] = {'max_temp': max_temp, 'min_temp': min_temp, 'icon': icon}

    # Return the updated temperature dictionary
    return temp_by_date
In this function:
- Dictionaries are used to store a list of the max and minimum tempteratures for every three hour period of a day, along with the icons for each day, using dates as values.
- The max and minimum temperature for each day are found using
max()andmin()on the stored lists. - The max and minimum temperature values replace the lists for each date and are returned with the respective icon.
And we can update home() again to call get_forecast_data() and get_max_min_temp(), and passing the result to render_template():
@app.route("/")
def home():
    latitude = 35.22592847208098
    longitude = -80.85293281605993

    weather_data = get_weather_data(latitude, longitude)
    temperature = weather_data['main']['temp']
    description = weather_data['weather'][0]['description']
    city = weather_data['name']
    icon = weather_data['weather'][0]['icon']
    icon_url = url_for('static', filename=f'icons/{icon_filenames[icon]}.svg')

    forecast_data = get_forecast_data(latitude, longitude)
    weather_by_date = get_max_min_temp(forecast_data) # Get max and min temperatures for each day with icons

    # Add weather_by_date as a parameter
    return render_template('weather.html', temperature=temperature, \
    description=description, city=city, icon_url=icon_url, \
    weather_by_date=weather_by_date)
Displaying the weather forecast using loops
So far, we’ve been just passing variables and displaying them to the user using Jinja templates. However, the 5-day forecast data is inside of a dictionary, so there is no single variable that we can call to display the temperatures as a table. That’s when for loops come into play.
The basic syntax for a for loop is the following:
{% for item in collection %}
    {{ item }}
{% endfor %}
As opposed to Python’s for loop, Jinja for loops requires the {% endfor %} statement to enclose the instructions in the loop.
For example, if we have a list of numbers:
list_of_numbers = [10, 20, 30, 40, 50]We could represent it using an ordered list and a for loop in a HTML template:
<ol>
    {% for number in list_of_numbers %}
    <li>{{ number }}</li>
    {% endfor %}
</ol>
The for loop would iterate over the list and create a <li> element for each element in the list.
This would be the output of the previous code:
<ol>
  <li>10</li>
  <li>20</li>
  <li>30</li>
  <li>40</li>
  <li>50</li>
</ol>
For our weather app, we can create a <table>, where each element of the dictionary would occupy a cell of each table row.
<body>
  <h1>{{ city }}</h1>
  <p id="description">{{ description }}</p>
  <div id="main-temp">
    <img src="{{ icon_url }}"/>
    <p>{{ temperature }}°C</p>
  </div>

  <table>
    <thead>
      <tr>
        <th colspan="3">5-day Forecast</th> <!-- Add a header that takes three columns -->
      </tr>
    </thead>
    <tbody>
      {% for date in weather_by_date %} <!-- Start the loop -->
        <tr>
          <td class="forecast-days">{{ date.strftime("%A") }}</td> <!-- Display the day's name -->
          <td class="forecast-icons"><img src="{{ url_for('static', filename='icons/' + weather_by_date[date]['icon'] + '.svg') }}" class="forecast-icon"></td> <!-- Dynamically get the corresponding icon for each day -->
          <td class="forecast-temps">{{ weather_by_date[date]['max_temp'] }}°C / {{ weather_by_date[date]['min_temp'] }}°C</td> <!-- Display max and min temperature -->
        </tr>
      {% endfor %}
    </tbody>
  </table>
</body>
Now, the app should look like this:

We can still add some more styling to enhance the look of the application before finishing, since right now things are a little hard to read.
Additional styling
To make the table more easily readable, we can add a semi-transparent dark background that contrasts with the white font.
/* Add padding, center text and align content vertically for table headers and data cells */
td {
    padding: 10px;
    text-align: center;
    vertical-align: top;
    /* Set a semi-transparent black background color and add margin between cells */
    background-color: rgba(0,0,0,0.4);
}

/* Increase header size, add a darker background and round the corners */
th{
    font-size: 1.5em;
    background-color: rgba(0,0,0,0.5);
    border-top-right-radius: 10px;
    border-top-left-radius: 10px;
}
And then extend the table to cover the full page’s width:
/* Set table width to 100% and remove cell borders */
table {
    width: 100%;
    border-collapse: collapse;
}
Finally, we can move the columns of the table closer by changing their alignment:
/* Align day labels to the right */
.forecast-days {
    text-align: right;
}

/* Align temperature data to the left */
.forecast-temps {
    text-align: left;
}
After applying this changes, the weather forecast application should look similar to this:

Final thoughts and next steps

Congratulations! You have successfully built a weather forecast application using Python and Flask. By now, you may have gained a good understanding of how to create a Flask application from scratch, fetch data from an API, and display it on a webpage using Jinja templates. You have also seen how to add styling to your application using CSS and how to make use of icons to enhance the look and feel of the application.
However, there are still many ways to improve this application, for example:
-
Add more data points: OpenWeatherMap’s API let’s you retrieve a lot more data than just what we used. You can add more information such as wind speed, humidity, and precipitation to provide a more complete weather forecast.
-
Add more interactivity: You can add more features to make the application more interactive and versatile. For example, you can add a field to allow users input their ZIP Code and convert it to coordinates for the program to use, or do it automatically by calling the web browser’s geolocation API.
-
Deploy the application: Deploying your application to a live server allows users to access it from anywhere in the world. Some hosting platforms you can use to deploy your Flask application are Heroku, PythonAnywhere, and AWS.
Overall, building a weather forecast application with Python and Flask is a great way to learn the basics of web development. By following this tutorial and exploring the next steps, you can create a more sophisticated application and take your skills to the next level. For example, take a look at how I expanded this application on this GitHub repository 🙂
Good luck!
You can take a look at all the code included in this article in this GitHub repository.